We’ve made it three weeks without extreme weather and/or climate change hysteria making rounds on social media. Unfortunately, that streak has come to an end, making the lives of most weather forecasters like me a lot more difficult.
We are quickly approaching climatological peak of the Atlantic hurricane season¹ (September 10th) (Figure 1), thus it should be NO surprise to anyone that we have seen an uptick in tropical activity. However, I stand corrected - people are losing their minds about it.
Hurricane Dorian is now a Category 1 storm (as of the time I wrote this article – September 6 at 9:06 PM EST) with maximum sustained winds at 92 miles per hour (80 knots), and it’s quickly pulling offshore moving northeast (Figure 2).²
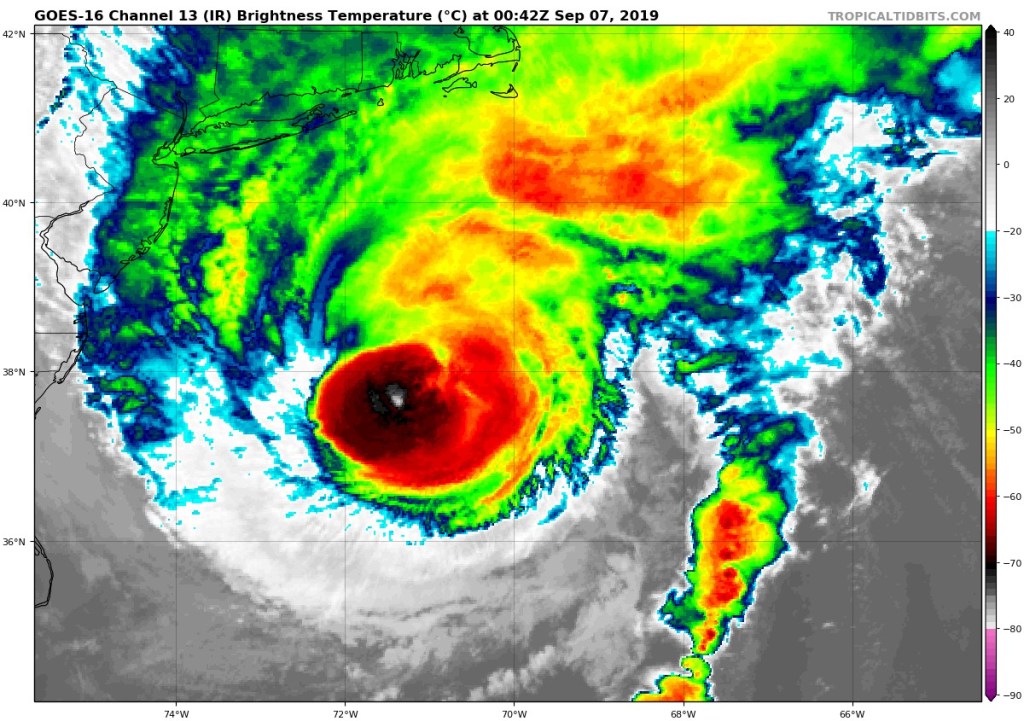
Dorian ravaged the Bahamas over Labor Day Weekend, as it stalled over Grand Bahama Island as a Category 5 hurricane. According to official reports, at least 30 people have died and unfortunately, that death toll is expected to rise in the coming days.
According to Dr. Philip Klotzbach, a meteorologist at Colorado State University, Dorian was the most intense hurricane (by wind speed and minimum central pressure) to strike the Abaco Islands and Grand Bahama.³ It was also the first Category 5 hurricane to make landfall on either island within the period of record keeping, which dates back to 1851.³ Hurricane Dorian also tied with the Labor Day (1935), Gilbert (1988), and Wilma (2005) for the second strongest hurricane on record in the Atlantic basin by wind speed (185 mph or 160.8 knots).³ The only hurricane that was stronger by wind speed was Hurricane Allen in 1980, which had maximum sustained winds as high as 190 miles per hour (165.1 knots).³
As usual, government officials, journalists, and even some meteorologists have taken these statistics and have been promoting climate alarmism about how hurricanes are becoming increasingly intense due to man-made climate change. They argue that warming oceans are providing more fuel to hurricanes, which is indeed true, however, that’s only one part of the story.
Without looking at hurricane mechanisms, it’s easy for one to be susceptible to these ideas. Therefore, it’s important we take a step back and look at the big picture.
Debunking the SST myth
I want to debunk the popular myth that has been circulating around the internet. Warmer sea surface temperatures (SST) does not guarantee that hurricanes will become more frequent or more intense.
While warm water temperatures extending from the surface down to around 150 feet (45.72 meters) below the ocean surface are required to be warmer than 80°F (26.67°C) for “fuel” for a tropical cyclone to develop,⁴ there are many other factors that govern hurricane activity not only on short-term time scales, but also decadal and millennial time scales, the latter of which I’m not going to explore in this article.
Warmer sea surface temperatures do not spontaneously spawn hurricanes. It just doesn’t work that way. Most of the time, there has to be a pre-existing atmospheric disturbance, preferably an area of low pressure where thunderstorms can form around (as that’s essentially what a hurricane is).
Low atmospheric pressure is caused by the convergence (meeting) of winds in the low levels of the atmosphere. Where these winds meet, they are forced to rise. In the Northern Hemisphere, low pressure systems spin counterclockwise as a result of the Coriolis Force. The Coriolis Force in and of itself initiates vorticity in the atmosphere whereby winds can converge at the surface.
In addition to low-level convergence, the atmosphere in the lower to mid-levels of the troposphere must be fairly saturated in order for tropical cyclogenesis.⁴ The air becomes more humid if there is more evaporation occurring, which is a function of warm sea surface temperatures.⁴ Once the atmosphere in the low and mid-levels of the atmosphere is saturated, that means clouds will form as the air reaches the dew point temperature whereby water vapor must condensate out into liquid water droplets.⁴
If there is very high thermodynamic instability, or a sharp decrease in temperature with altitude, then more condensation will occur. The more condensation that occurs releases latent heat into the atmosphere, causing it to warm up (Figure 3).⁴ As the warmer air rises and expands, it’s forced to diverge once it reaches the tropopause and flow clockwise, thereby decreasing the air pressure at the surface.⁴
If the outflow of winds high in the troposphere is outpacing the converging winds at the surface, the air pressure will decrease around the center of the storm.⁴ If the central air pressure in the eye decreases, the storm will strengthen.⁴
The lower the minimum central pressure of a tropical cyclone is, the sharper the pressure gradient (change in air pressure with distance) will be between the eye and the surrounding environment. This sharp gradient creates an imbalance which the atmosphere tries to equalize by increasing the wind speed.
While warm sea surface temperatures, high moisture content, vorticity, and low pressure are needed for hurricane development, other factors like dry air and wind shear can drastically weaken a tropical cyclone or inhibit any tropical development altogether.⁴
If dry air is too abundant, that suppresses convection (cloud building), and if wind shear is too high, then the hurricane becomes vertically tilted or disorganized, cutting off the updrafts formed by convergence.⁴
Whether natural or man-made, global warming periods are known to increase the frequency of El Niño events because of the general warmth.⁵ ⁶ When there is an El Niño occuring, wind shear in the Atlantic tends to dominate preventing tropical cyclones from developing.⁵
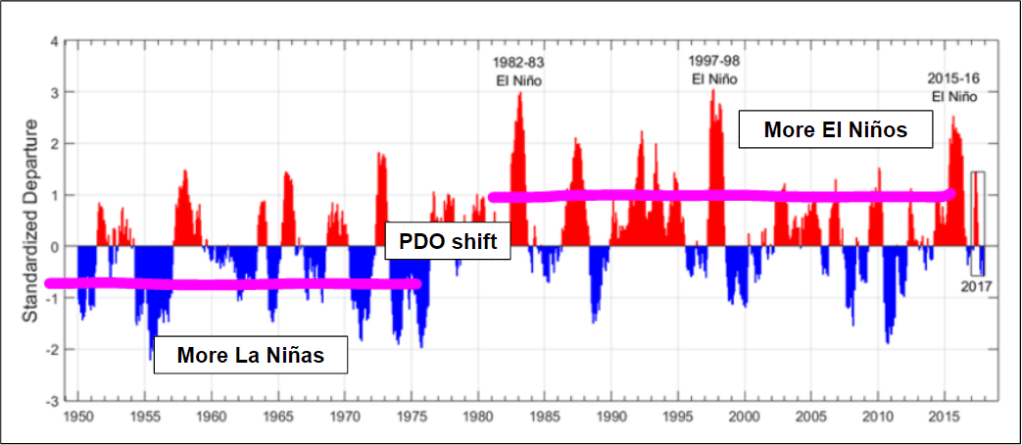
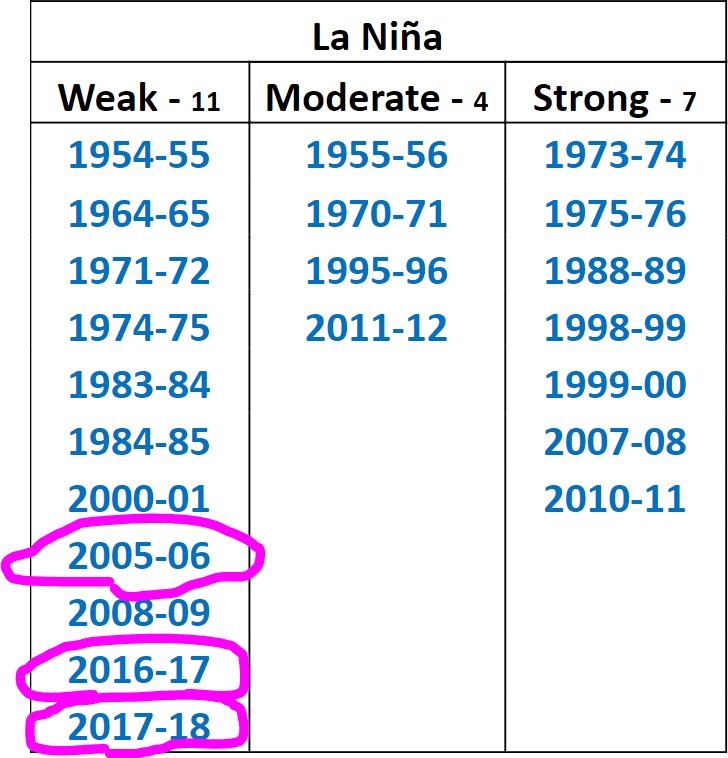
La Niña years conversely tend to produce more hurricanes in the Atlantic basin due to lesser wind shear. It is for this reason for why I think that the Atlantic basin was very quiet between 2005 and 2017. Keep in mind, hyperactive seasons like 2005, 2017, and even 2018 (not hyperactive, but bad) were La Niña years.⁷
Thus, one has a really hard time making the argument that global warming will produce stronger and more frequent hurricanes in the Atlantic. There’s no sound science or statistics to back claims like that.
There are other theories that suggest that while hurricanes will NOT become more frequent or intense due to climate change, they may become more wetter. By wetter, they mean increased rainfall. This is an interesting and plausible theory. NOAA has suggested it. But, until we start to see increases in hurricane rainfall, this theory doesn’t hold water.
REFERENCES
[1] “Tropical Cyclone Climatology.” National Hurricane Center. Accessed September 6, 2019. https://www.nhc.noaa.gov/climo/.
[2] Cowan, Levi. “Current Storm Information.” Tropical Tidbits. September 6, 2019. Accessed September 6, 2019. https://tropicaltidbits.com/storminfo/.
[3] Klotzbach, Philip. “Hurricane Dorian Meteorological Records/Notable Facts Recap.” Colorado State University. September 5, 2019. Accessed September 6, 2019. https://tropical.colostate.edu/media/sites/111/2019/09/Hurricane_Dorian_Records.pdf.
[4] “Hurricanes: growth processes.” WW2010. 2010. Accessed September 6, 2019. http://ww2010.atmos.uiuc.edu/(Gh)/guides/mtr/hurr/grow/home.rxml.
[5] “Hurricanes: Interaction with El Niño.” WW2010. 2010. Accessed September 6, 2019. http://ww2010.atmos.uiuc.edu/(Gh)/guides/mtr/hurr/enso.rxml.
[6] Gale, Kaitie. “The multivariate ENSO Index.” ResearchGate. September 2018. Accessed September 6, 2019. https://www.researchgate.net/figure/1-The-multivariate-ENSO-Index-Data-source-NOAA-ESRL-Physical-Sciences_fig3_327559287.
[7] “El Niño and La Niña Years and Intensities.” Golden Gate Weather Services. July 2019. Accessed September 6, 2019. https://ggweather.com/enso/oni.htm.
Categories: Weather

Leave a comment