By Chris Martz | October 22, 2019
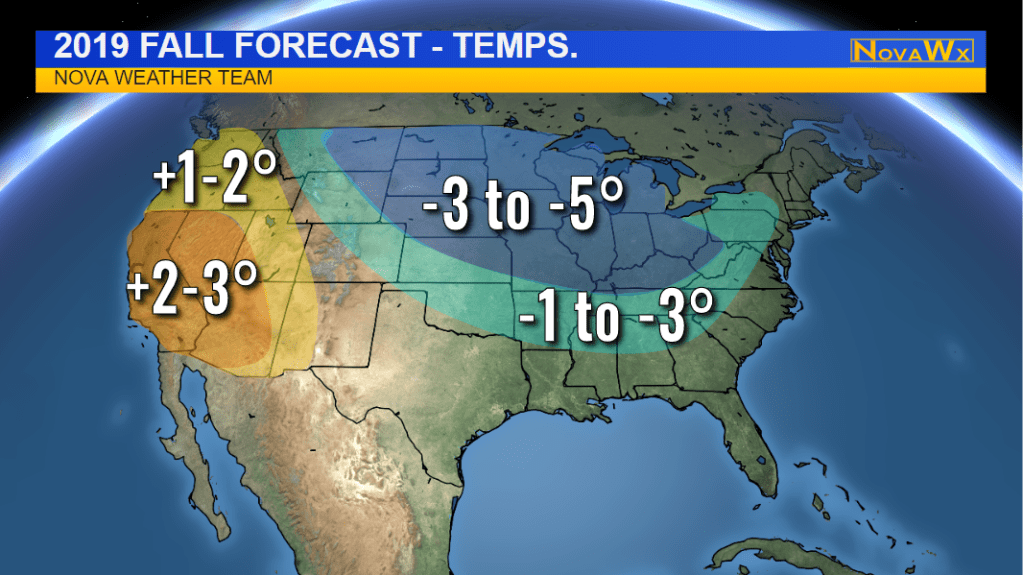
Back in August, I released my autumn outlook. I predicted below average temperatures stretching from Big Sky Country all the way east to the Ohio Valley and above average temperatures across much of the Desert Southwest.
I also forecasted dry conditions to ensue over the West Coast, Desert Southwest, Deep South, and Southeast, whereas the Ohio Valley, Mid-Atlantic, and Northeast were to have above average precipitation, with much of the northern tier of the country near average, give or take.
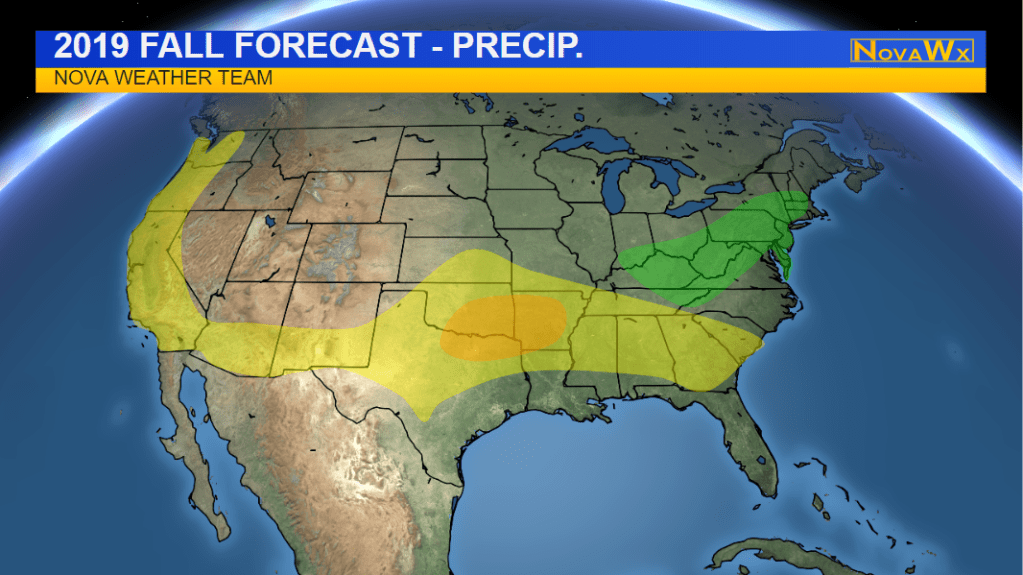
My autumn precipitation forecast has so far been a total bust, I must admit. The only area I have nailed is Texas north to Oklahoma and eastward to South Carolina.
As far as temperatures go, my forecast has been alright, but not great. Areas that have been so far accurate are the Northern U.S. Plains, Upper Midwest, and far Northeast. The rest of the country has been a bust.

So, what lies ahead as we close out October and roll through November? While I can’t guarantee anything for a long-range forecast, I do have some thoughts, so let’s take a look at some data.
1. The Upper Air Pattern
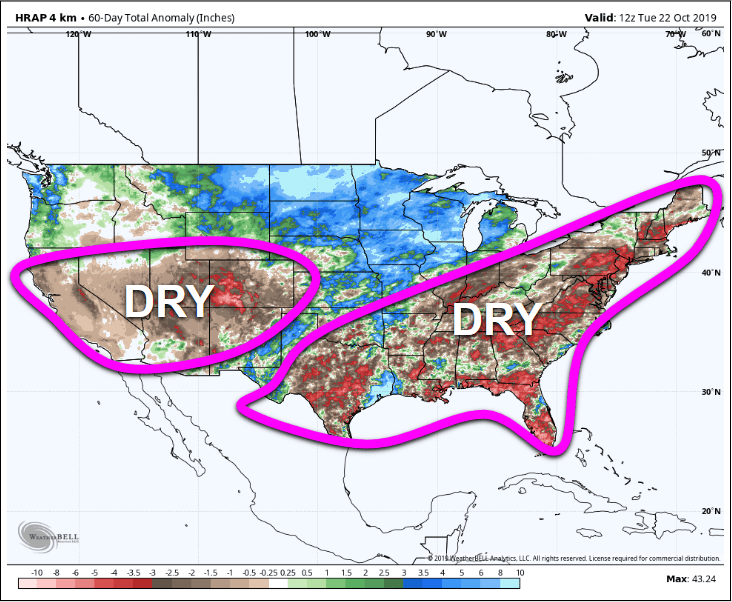
The weather we have been observing across the Lower 48 this month has been very divided depending upon the region you’re in; it’s as divided weather-wise as is is politically.
Everywhere west of the Great Plains have been exceptionally cold relative to average this month; 7-14°F below average, while everywhere east of the Mississippi River has been warmer than average by 3-8°F. This is because an unseasonably deep trough is over the Western third of the nation, while a ridge is in place over the Southeast.

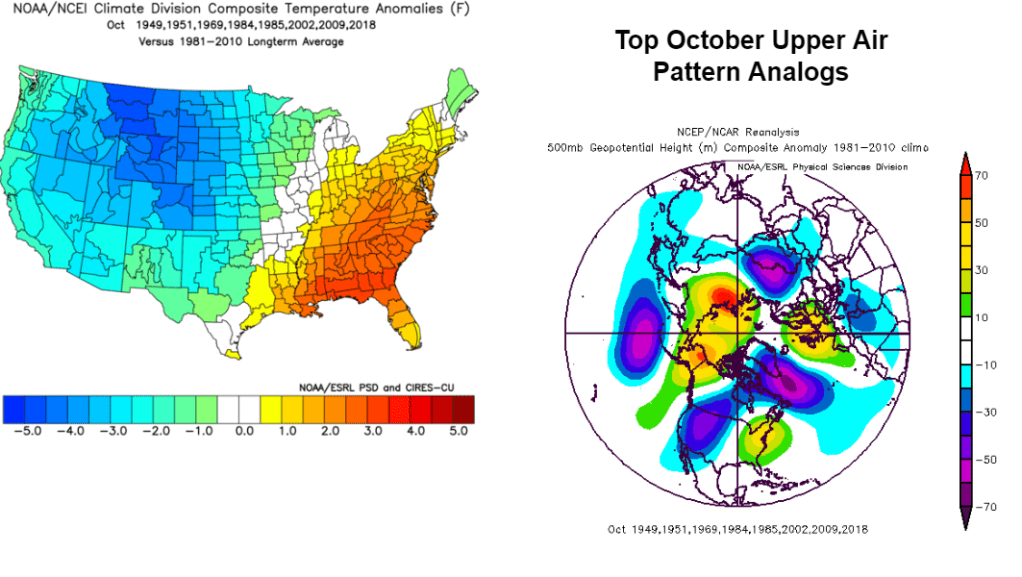
One simple long-range forecasting technique I use is to find years in the past with similar upper air patterns at the 500 millibar level; in this case, our best years are 1949, 1951, 1969, 1984, 1985, 2002, and 2009.
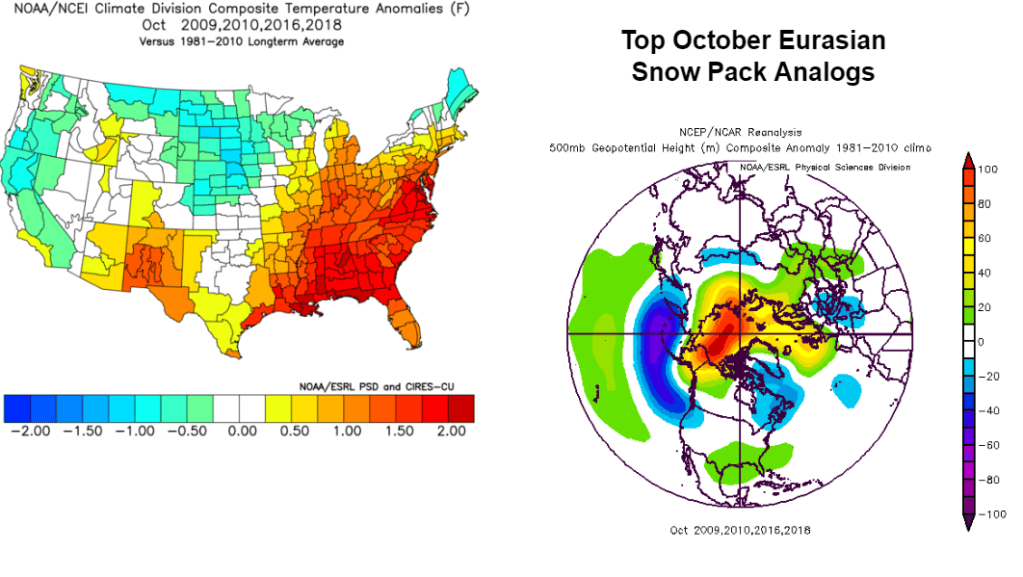
2. Siberian Snow Pack
Another long-range forecasting technique I like to use as we inch closer to winter is to monitor the Siberian snow pack.
This year, like many recent years, the snowpack has been running above average. It has slacked off a bit, but models are suggesting that it’s about to make a big comeback.

Years where the October snow pack over Eurasia was been similar to this year are 2009, 2010, 2016, and 2018.
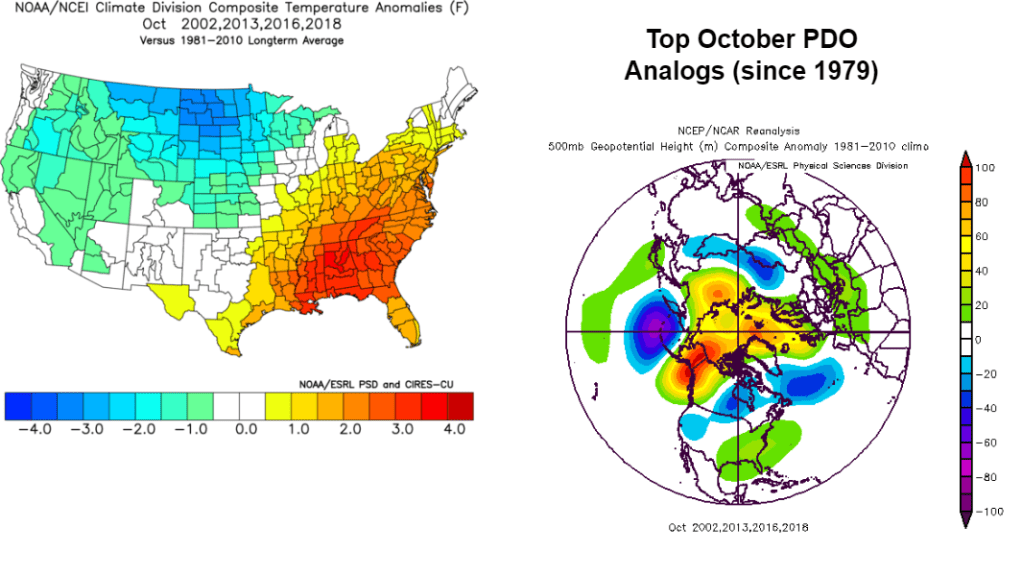
3. Warm Sea Surface Temperatures in the North Pacific (+PDO)
A large area of anomalous warmth has developed in the North Pacific Ocean, which we refer to as a positive Pacific Decadal Oscillation (+PDO).

This tends to allow a ridge to develop over the west coast of the U.S. by a positive PNA, though in order for this to fully take effect, the EPO has to be negative, otherwise the ridge remains over the ocean which allows a trough to set up over the west coast. This month, neither the EPO or PNA have been both favorable long enough to shift the trough east to cause a typical -EPO/+PNA pattern (trough in the east, ridge in the west).
Either way, the +PDO is still a decent indicator of how the weather can shape up to be, and our top analogs (2002, 2013, 2016, and 2018) confirm what we have observed so far this month.
ENSO conditions are fairly neutral, thus it’s impact shouldn’t be as profound. Furthermore, computer models are showing everywhere being warmer than average during the month of November, and I quite frankly think that’s complete nonsense and unrealistic.
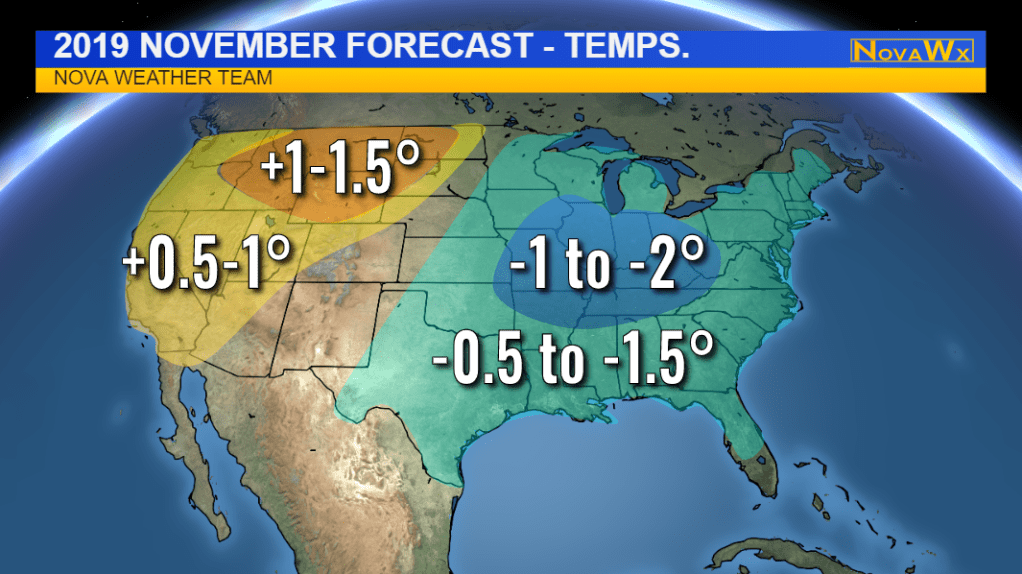
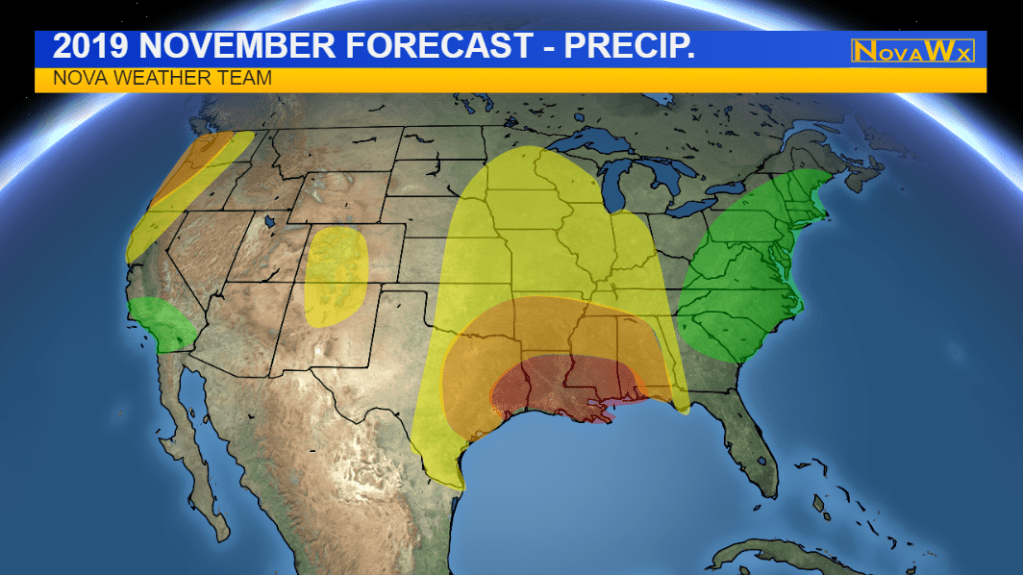
With the data we have looked at in mind, let’s forward the analogs into November. As you can see, the west becomes warm and the east becomes cold. I am thinking this is a very likely possibility.

So, without further ado, here is my official 2019 autumn temperature and precipitation outlook. Again, I want to make it clear that there are no guarantees, but based on the data available and the data I’m looking at, this is my prediction. We’ll see what happens!
If you would like more specific details for your location (state or region), please contact me by email. It might take a day or two to respond, though I am generally quick.


Categories: Weather

Leave a comment